
1、前言
在上一篇中已经搭建了Prometheus平台,仅部署服务端还不够,依赖采集端来收集数据。本篇操作依赖一、运维监控-部署教程-《Prometheus 》的基础上的操作
2、本文目标
在Linux主机中安装node_exporter
使用prometheus平台监控Linux主机资源
3、部署步骤
3.1软件包下载
Linux系统采集模块: node_exporter-1.6.1 点击下载
下载完毕后上传至服务器
3.2进入程序目录并解压
cd /data/node_exporter
tar -xvf node_exporter-1.6.1.linux-amd64.tar.gz
3.3创建服务文件
vi /etc/systemd/system/node_exporter.service[Unit]
Description=Prometheus node_exporter
[Service]
User=nobody
ExecStart=/data/node_exporter/node_exporter-1.6.1.linux-amd64/node_exporter --log.level=error
ExecStop=/usr/bin/killall node_exporter
[Install]
WantedBy=default.target3.4启动服务
systemctl start node_exporter3.5查看服务状态
systemctl status node_exporter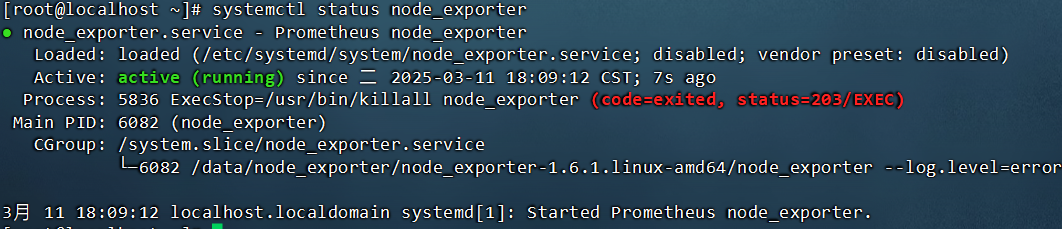
3.6添加开机启动
systemctl enable node_exporter3.7将node_exporter加载到promtheus平台
此处为promtheus的配置文件
vi /data/prometheus-3.2.1.linux-amd64/prometheus.yml在scrape_configs模块下加入
scrape_configs:
  - job_name: 'prometheus'
  static_configs:
  - targets: ['localhost:9090']

  - job_name: 'host_monitor'
  static_configs:
  - targets: ['localhost:9100']
3.8重启prometheus服务
添加完以后需重启才可生效
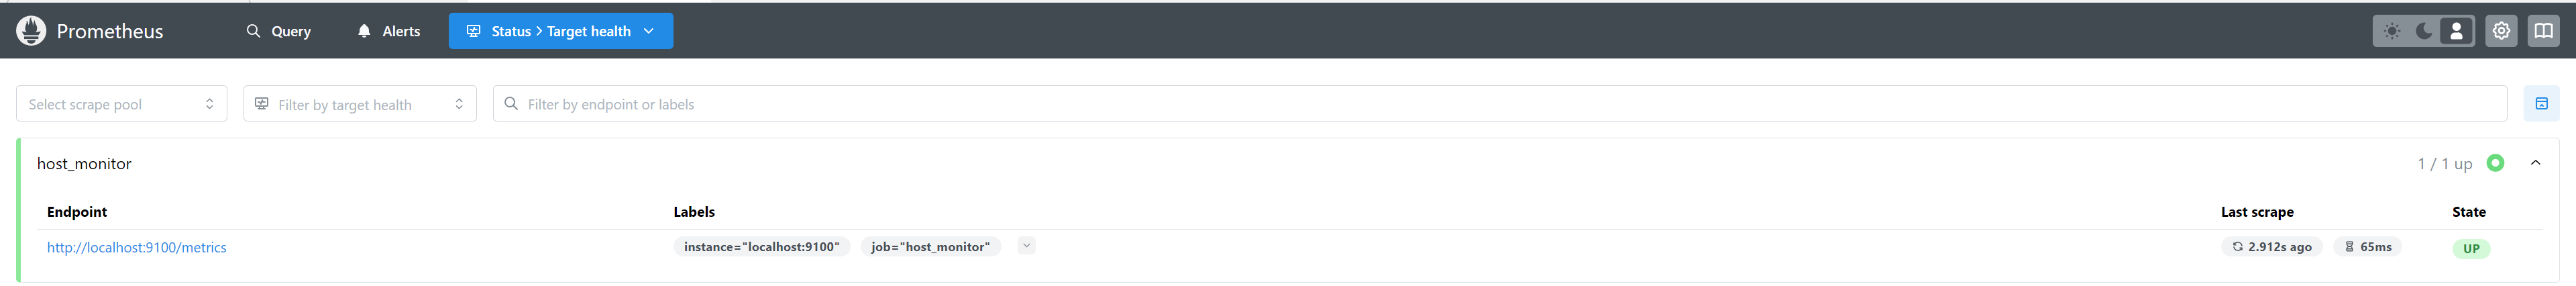
systemctl restart prometheus3.9验证是否在线
浏览器中输入 http://ip:9090在打开的浏览器页面的Statuc—Targets页面可以查看到host_monitor目标节点
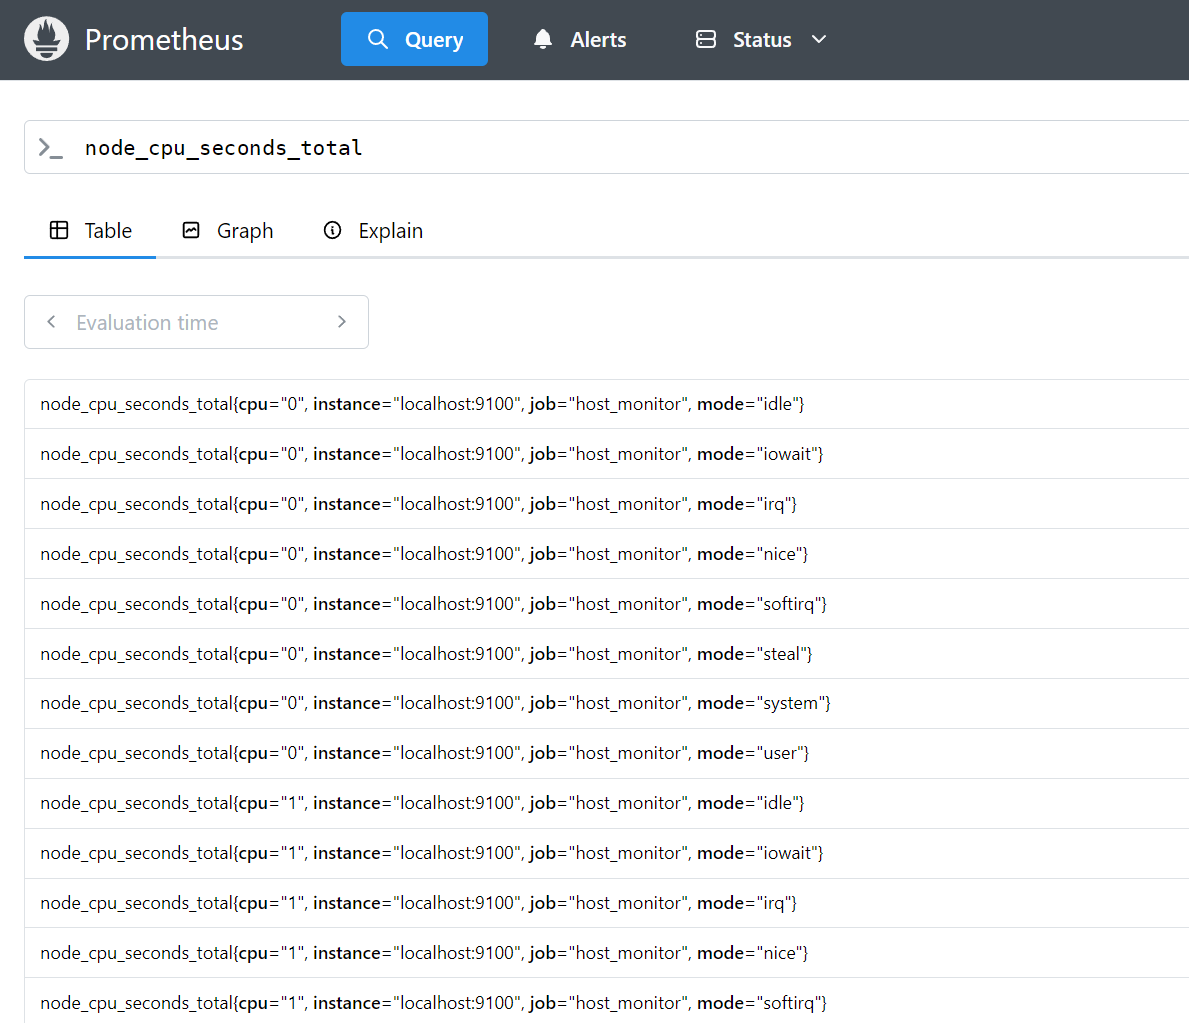
指定查询
在首页页面中的检索框中使用node_cpu_seconds_total 进行检索。
4.安装结束
以上为prometheus监控单机设备
下一章节会针对多台主机进行的自动发现,将主机信息进行收集获取。
以及可视化页面监控